You are only fooling yourself if you don’t think there’s a high degree of uncertainty about the best path forward.
In these times, alternatives and opposing opinions on the problems and solutions surrounding the pandemic need to be heard, not silenced.
While COVID-19 presents us with a particularly thorny case of decision making based on scientific uncertainty, this issue is perennial in science.
– Peter Attia, M.D., “The importance of red teams”, May 24, 2020
My interest in writing this post
Over the years I have spent a fair portion of “free” time learning about predictability and uncertainty through randomization-based inference data analysis. In particular, from works by Dr. Sam L. Savage (author of “The Flaw of Averages”), Douglas W. Hubbard (author of “How to Measure Anything” and “The Failure of Risk Management”), and Dr. George W. Cobb (author of several statistical textbooks and papers advocating for these inference methods – see “The Introductory Statistics Course: a Ptolemaic Curriculum?”). And a bit more recently about process behavior charts from works by Dr. Donald J. Wheeler (author of “Understanding Variation: The Key to Managing Chaos” and “Making Sense of Data”).
What draws me to their works is a common theme that aligns with my study of “lean thinking”, which has influenced my learning approach. That is, start with existing insights from what I already know and understand well about a problem or question, add some fundamental analysis concepts and learning tools that I can grasp relatively quickly, and then practice (every chance I get) with them to develop my skills and capability to effectively and efficiently guide the next most valuable learning efforts, identify economically worthwhile continuous improvement opportunities, and enhance the decision-making process used to support or supplement my intuitions (experienced recognition).
This emphasis on creating an experiential foundation to build on, to first gain deeper insights into essential concepts of statistical inference and experimental design, I have found to be very helpful. Here is a recent example.
A simple message found often in Dr. Wheeler’s books and articles is “No data have any meaning apart from its context.”1 The deeper significance related to data analysis only truly “hit me” after I used a spreadsheet to duplicate a few simple experiments he suggested, and then extended and explored a bit further based on what I found. That experience provided insights into the significance behind this humble statement that reading alone had never provided me. From those insights, I now see why I might want to validate a very key assumption prior to using any theoretical probability distribution or any data analysis that uses them (but that is another story for another time).
As an added bonus that I did not anticipate, I also now realize more why Dr. Savage also for some time has been expressing the depth of learning from these types of experience as “Connecting the Seat of Intellect to the Seat of the Pants.”2 That is, a depth of learning that occurs when intellectual (explicit) forms of learning are combined (connected) with experiential (tacit) forms.3 And while that too is another story for another time, it provides the context behind the motivation for this post.
Today’s focus and the data used
Today, I want to share a little from my recent practice with a process behavior chart (PBC) to help me look deeper into Colorado’s COVID-19 data, which has obviously been on a lot of people’s mind lately, including mine, and rightly so. Specifically, I was curious to see how the PBC might help me better understand something about the virus’s spread and the effectiveness of some of the broader responses to it here in Colorado. In particular, what I could learn beyond the charts I found available on the state’s web site.
“So much of what we call management consists in making it difficult for people to work.” — Peter Drucker
“As a job seeker, remember this: You only lack experience if they want it done the same old way.” — Robert Brault
“Deciding what not to do is as important as deciding what to do.” — Steve Jobs
“Out of clutter, find simplicity.” — Albert Einstein
KLRUS14 – Monterey
In January leading practitioners and coaches of the Kanban Method gathered at the Kanban Leadership Retreat. While preparing our “just-in-time” agenda at the start, a topic suggested for discussion was a variation on a question we had all heard often, “How does ‘kanban’ impact my role: as a Project Manager, or as a Business Analyst, or as Product Manager, or as a Program Manager?” It was definitely interesting to hear responses from others to this question, and for me it was one of the more useful sessions.
First Things First
Since the Kanban Method is not a specific workflow methodology or process, and therefore is not something that replaces your current workflow process, but rather a tool that can be used to improve any workflow process, it doesn’t prescribe specific roles. It isn’t that kind of tool.
It’s also helpful to consider that improving your current workflow, even in significant ways, won’t necessarily require creating and defining “new roles and practices.” Still, it is important to recognize using it as a tool to improve your current workflow process should clearly result in some noteworthy changes. Right?
A good place to start is to understand upfront that a core component of the “Kanban Method” is using a kanban system, or even more fundamentally using a “pull based system”, to help address obstacles to creating and maintaining a predictable workflow and improving performance over time. That is, if you’re not familiar with “pull systems”, I’d suggest to anyone using the Kanban Method to first focus on understanding the fundamental changes to pull thinking. Allow this new thinking in turn to influence the ideas and experiments (changes) that emerge for improving the design and operations of your workflow process.1 Then, if necessary and only as needed, consider any benefits that might exist from adding (or removing) roles and associated practices. (more…)
“In everyday life, the Flaw of Averages ensures that plans based on average customer demand, average completion time, average interest rate, and other uncertainties are below projection, behind schedule, and beyond budget.” – Sam L. Savage, 2009 – The Flaw of Averages
“Variation is the hard reality, not a set of imperfect measures for a central tendency. Means and medians are the abstractions.” – Stephen Jay Gould, 1985 – “The Median Isn’t the Message”
“Essentially, all models are wrong, but some are useful” – George E. P. Box, “Empirical Model Building and Response Surfaces”, (1919 – 2013)
“Remember that a model is not the truth. It is a lie to help you get your point across.” – Sam L. Savage, “The Flaw of Averages”, 2009
“You are allowed to lie a little, but you must never mislead.” – Paul Halmos, mathematician, (1916 – 2006)
Last week I read an article about yet another tool showing the ability to produce CFDs (cumulative flow diagrams). Maybe you’re already a user of one of these tools that help you visualize your workflow, and generate them for you automatically (or “automagically”) as part of reports they provide. Or, perhaps like me, you still generate them mostly using MS-Excel. Either way, have you wondered just a little about how a CFD works?
As most do, this article displayed a line extending vertically between “stages” on the CFD (or workflow processes, as I often call them) and identified this distance as the WIP (work-in-progress) on a specific date for the respective stage (or stages) of interest. There was also a description of another distance, a line extending horizontally between stages of interest on the CFD and identifying it as the “average lead time” for the requests (work items) arriving on a specific date. That is, the average time for a request (work item) to “flow” through (arrive into and depart out of) one or more stages of interest. Lastly, there was a description of a sloped line, as a mean delivery rate of requests (work items) flowing into or out of a stage (workflow process) depending on viewing the workflow upstream or downstream. Note: for more on the basics of reading a CFD, see this earlier post here.
A Difference Is Not An Average, Right?
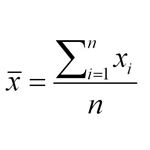
It is easy to understand that WIP is simply a “difference” between two counts on the CFD and represents the number of requests (work items) at a point in time. Similarly, seeing the slope as a simple rise over run calculation of a number of requests per unit of time (a rate over a period of time of interest) is not a complex concept to accept. But, what about the notion of the “average lead time” derived from the CFD? How is it a “difference” between two points in time read from the CFD (ex. calendar dates) can represent an “average” unit of time for a request (work item) to flow through a stage (workflow process)? A “difference” that represents N numbers summed up and divided by N. Yes, really! But how can this be?
“The instinctual shortcut…when we have ‘too much information’ is…picking out the parts we like and ignoring the remainder, making allies with those who have made the same choices and enemies of the rest.” – Nate Silver, American statistician, writer. “The Signal and the Noise: Why So Many Predictions Fail – but Some Don’t” (2012)
If you want to be competent at continually uncovering the unknown, strategic processes need to be based on learning not planning…in the fast paced world of twenty-first-century business, the focus of strategic work is no longer about making decisions – it’s about making discoveries. It is about discovering what you don’t know that you don’t know.” – Rod Collins, author, speaker, consultant; formerly Chief Operating Executive at Blue Cross & Blue Shield Federal Employee Program. “Why Planning Is No Longer a Strategic Activity”, (2013)
Over the last several months I’ve gratefully appreciated opportunities to present at conferences and user groups in Denver, Chicago, Houston, and Boston, and will have one more opportunity to close the year presenting in Pittsburg come Dec. While discussing possible topics with organizers of these events, most felt a presentation discussing some myths and misconceptions about the Kanban Method would be of interest and benefit for their attendees. [Note: you can find additonal context, and a bit about the initial motivation for talking more about these myths and misconceptions in my earlier post titled “The Kanban Method: Is It Just Scrum With Tweaks or Is There More?”]
The latest variation of my presentations on this topic was at the Agile New England user group in Boston, where they capture many, if not all of their monthly presentations, on video and make them available publicly. You’ll find this video below. If you’re in the Boston area and not familiar with ANE yet, I’d encourage you to visit their website here.
To assist with viewing the video I’ve listed a mini-index (below) indicating a few logical partitions where one might stop and come back to if you’re unable to sit through the presentation in a single sitting. [Note: this particular presentation allowed for a number of questions to be taken throughout, and not just at the end.] I hope you find it interesting. As per a quote I heard once somewhere that has really stuck with me, “the greatest learning occurs at the interface of disagreement” (adding, provided there is some constructive dialogue). So, if you feel I’ve mistated something, could articulate something a bit more effectively, or you disagree with something, please let me know.
Logical partition points after intro material:
07:23 – A taste of LKNA2013 from Chicago via Boston
07:56 – Getting on the same page with the term “kanban”
10:53 – Why is this important?
13:13 – If you take away “one” thing only
14:40 – First of the “myth and misconceptions”
17:49 – Second of the “myth and misconceptions” (including a number of questions from attendees)
42:57 – Notes on the term “iterate”
43:50 – Notes on decoupling activities
45:36 – Third of the “myth and misconceptions”
57:27 – Closing Q&A
I want to thank again here a few of the people from ANE who work hard on a volunteer basis to provide this first class user group in the Boston area. Thanks to ANE Member Shyam Kumar for his persistance, as we started talking about this opportunity some time ago and patitiently working through schedules. Also thanks to ANE’s President, David Grabel, ANE’s Vice-President, Tom Woundy, and ANE’s Program Coordindator, Ron Morsicato, for their efforts that evening and prior, contributing to a first class user group operation. Lastly, thanks to ANE Member Ron Verge who video-taped, edited, and put togther the video.
“Errors using inadequate data are much less than those using no data at all.” – Charles Babbage, English mathematician, philosopher, inventor, mechanical engineer, invented the first mechanical computer (1791 – 1871)
“I always avoid prophesying before hand, because it is a much better policy to prophesy after the event has already taken place.” – Winston Churchill, British orator, author, and Prime Minister during WWII (1874-1965)
“Policies are many, Principles are few, Policies will change, Principles never do.” – John C. Maxwell, evangelical Christian pastor, speaker, and author of 60+ books primarily about leadership (1947 – )
“We’re entering a new world in which data may be more important than software.” – Tim O’Reilly, founder of O’Reilly Media, supporter of the free software and open source movements (1954 – )
This question below came up recently on our Agile Denver Kanban SIG (special interest group) LinkedIn discussion list.
“I am working for an organization that has ‘Lab Week’ six times a year. Lab Week encourages innovation by setting aside time for engineers to work on whatever they want. My current conundrum is, what do I do with the work items on my team’s Kanban board, specifically those in To Do or Doing, during Lab Week?
It feels wrong to put them back in the backlog, but keeping them in To Do or Doing will affect lead/cycle time. While this is reality, it is only reality six times a year. In the interest of predictability I think I would want to know what lead/cycle time is without the impact of Lab Week and then factor in Lab Week when we hit a Lab Week.”
I had two immediate responses to this interesting question. First, teams in software development and IT/IS organizations are familiar with the basis for this question, and I’m guessing it comes up in a number of non-IT/IS or non-software development contexts as well.
Second, there is already an upfront discomfort with the idea of moving work items back to the “backlog” that have been “pulled” into the ToDo (or Ready, On Deck, etc.) workflow process states. I’m wondering what signal is this discomfort providing to us?I’m guessing the discomfort is even greater with the idea of moving work items back to the backlog that made it to some state of Doing in the workflow process. In essence, this would be “resetting the clock” for a number of work items already considered work in progress for some period of time, and with expectations, I’m sure they would be completed within some known SLA.
Just what I like, “real world” questions in particular when they come with some “pain points” clearly identified upfront. As I continued to think about this one more, it felt like a “perfect” opportunity to raise what I feel is a related question and discuss them together in this post. When discussing metrics as part of measuring and managing flow, the question below is one I raise often with others who are applying the Kanban Method to their workflow processes.
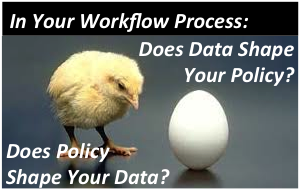
“In your workflow process context: Does Data Shape Your Policy or Does Policy Shape Your Data?”
How might we in the case of a “Lab Week” produce the metrics we want and visualize this information without any “discomfort” of doing post-collection adjustments or moving (resetting) work items back into the backlog? What can we learn from thinking about and responding to this “Lab Week” question that applies beyond the original basis itself in how we develop policies for managing our workflow processes?

 Since the Kanban Method is not a specific workflow methodology or process, and therefore is not something that replaces your current workflow process, but rather a tool that can be used to improve any workflow process, it doesn’t prescribe specific roles. It isn’t that kind of tool.